Managers can't beat the market. But, Monkeys can.
A test of alternative index strategies found that they all had an edge.
Here's a look at annualized returns, 1964 to 2012.
Traditional index 9.7% weighted by market cap
Equal weighting 11.5%
Value tilting 11.2% low PE
Low volatility 11.8% stable, good dividend stocks
"Fundamental" investing 11.6% by sales, profits, dividends...
Monkey throwing darts 11.3% random selection
NOTE: Monkey is average of 100 simulations, SOURCE: "The Surprising 'Alpha' from Malkiel's Monkey
and Upside-Down Strategies" by Robert Arnott, Jason Hsu, Vitali Kalesnik, and Phil Tindall
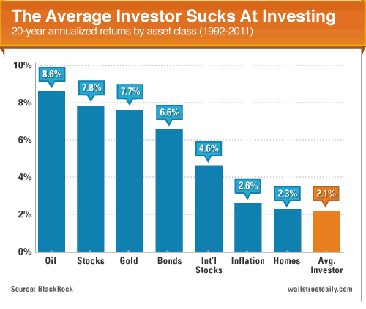
INVESTOR PERFORMANCE
Everybody would like to beat the market.
And with the above information being no secret, it seems that it should be easy.
However, the vast majority of investors do not even match the market performance.
Even the professional managers as a group do not beat the market.
The average investor lags the market terribly. They do not even keep up with inflation.
This is largely due to buying more as the market nears its top,
and selling in despair as the market collapses and hits bottom.
Markets collapse and hit bottom because so many investors are selling.
So, it is natural that the crowd will be hurt by their own collective rush to sell.
Of course, somebody is buying every share that the fearful crowd is selling at the bottom.
Just as somebody was selling at the top when the crowd paid top dollar.
There is always someone on the good side of every bad trade.


| |
| |
| |
| |
| |
| |
Good Macro
Stock Market
Wide diversification
is only required
when investors do
not understand what
they are doing.”
Warren Buffett
is only required
when investors do
not understand what
they are doing.”
Warren Buffett
“The way to become rich is to put all your eggs in one basket,
and then watch that basket.”
-- Andrew Carnegie 1835-1919, American Industrialist, Philanthropist
and then watch that basket.”
-- Andrew Carnegie 1835-1919, American Industrialist, Philanthropist
"Golden Cross" is bullish when the 50-day simple
moving average is above, or equal to, its 200-day
simple moving average.
moving average is above, or equal to, its 200-day
simple moving average.
Declining Unemployment is bullish.
Positive slope is bullish.
Bull markets persist until a recession approaches. Recessions are normally preceded by rising
short-term interest rates and a flattening of the Yield Curve. Corporate Profits slip and then
Unemployment rises as a recession is very near. Stocks lose their momentum, stalling and
then slipping in a typical correction/dip. But they do not recover fully as the recession nears.
This will be signalled by the SMA Chart. The market will then crash as the recession begins.